Order Manager
Version 8
Order Manager
Version 8
Contents of this Topic: Show
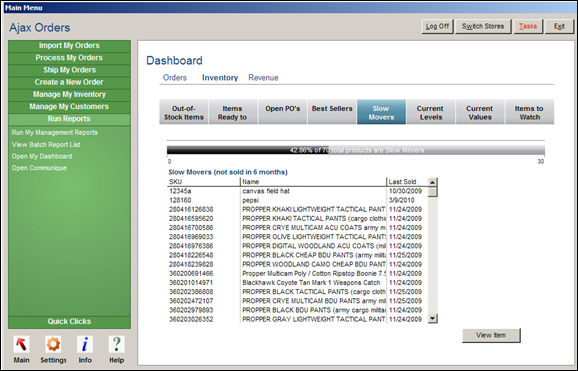
The Dashboard feature provides important statistics about your store's current status and recent performance. To access this information, go to the Main Menu>Run My Reports>Open My Dashboard.
Depending on your version of MS Office/Access, you may need to install the Graphs feature of MS Office in order for the Dashboard charts to work properly. This feature may not be selected for installation by default. If it is not installed, you may get an error stating that the OLE Server is not registered. Rerun the installer and modify the installation to include MS Graph.
The Dashboard data can be hidden from users who should not have access to this information by using Monsoon Order Manager's Security System.
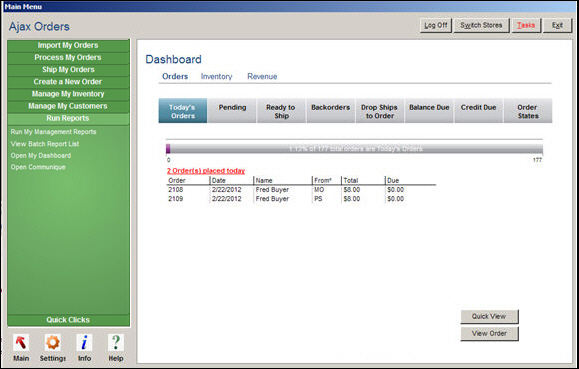
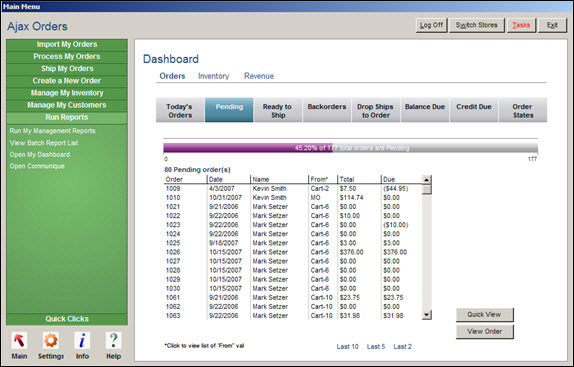
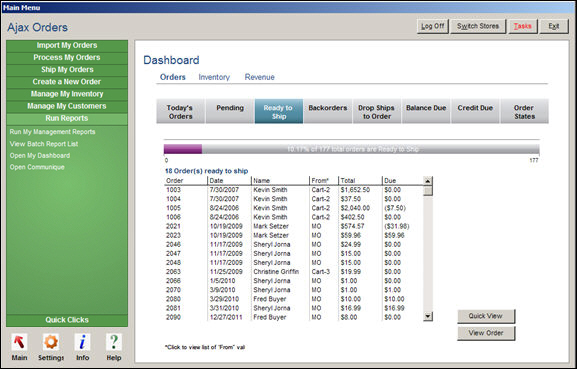
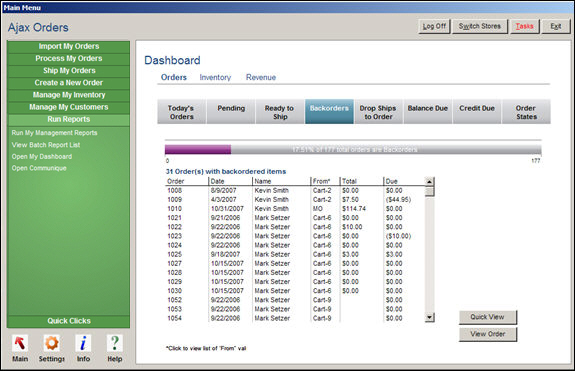
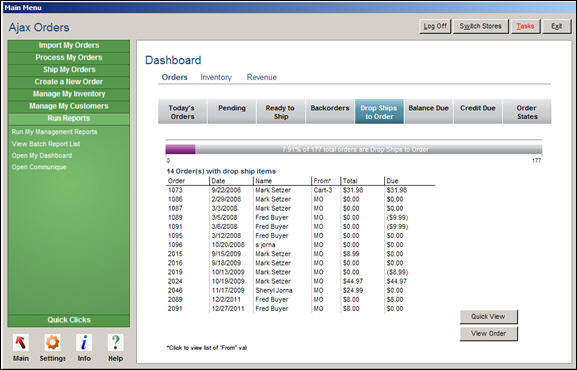
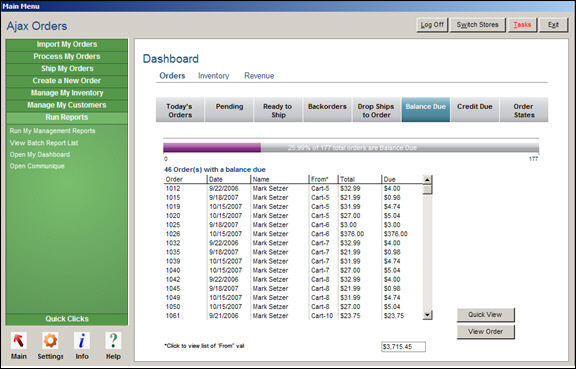
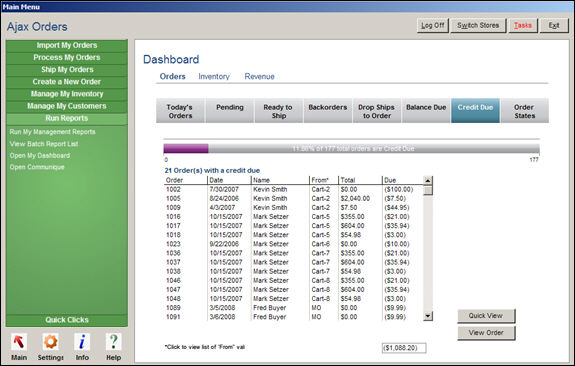
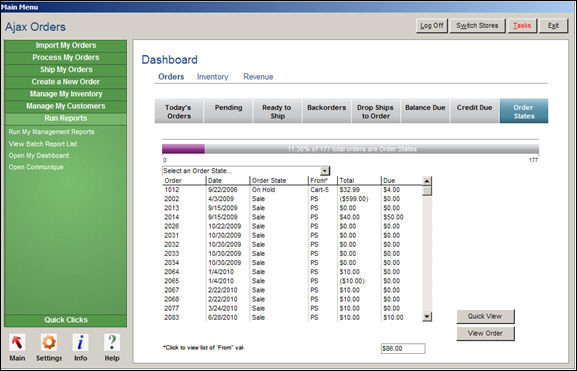
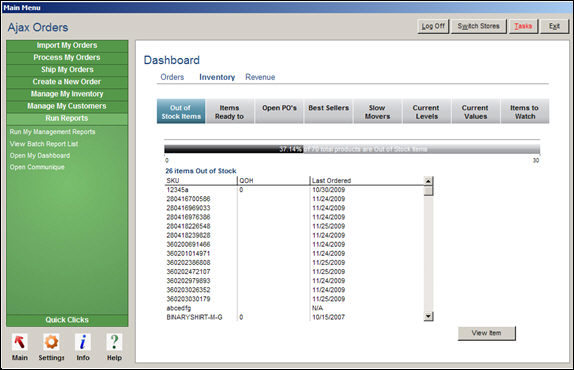
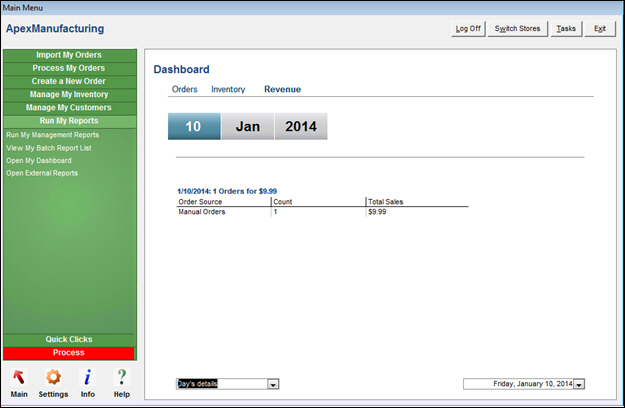
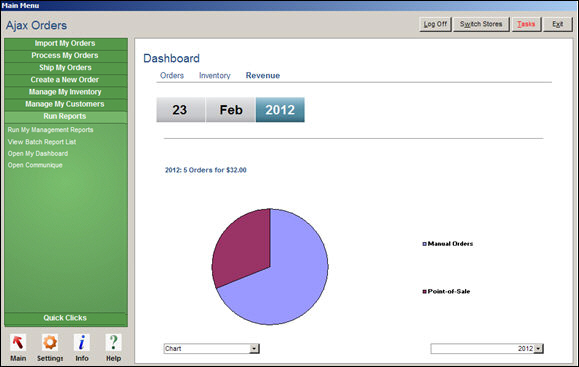
When the Dashboard home page opens it shows the daily order totals, and includes buttons which allow the user to drill down into the details of orders grouped by certain characteristics. For example, select Today's Orders to view all orders placed on the current day, or Drop-Ships to Order to see a list of orders containing items to be drop-shipped, for which drop-ship purchase orders have not yet been created.
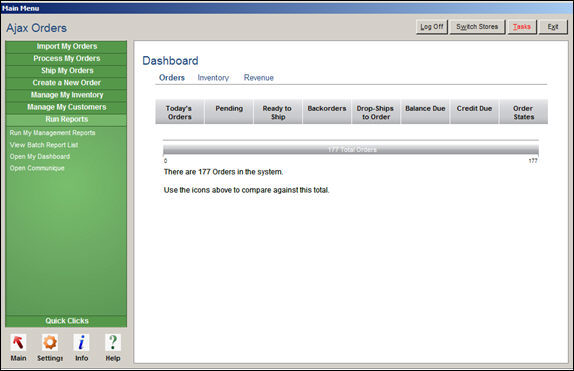
Dashboard Orders: Summary
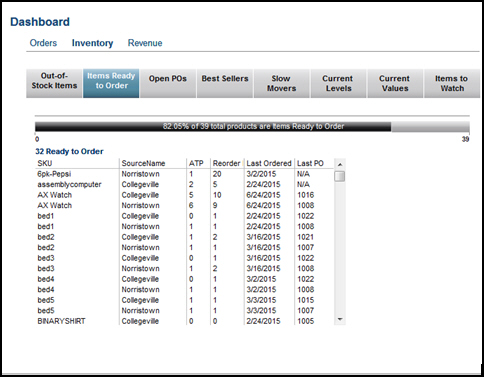
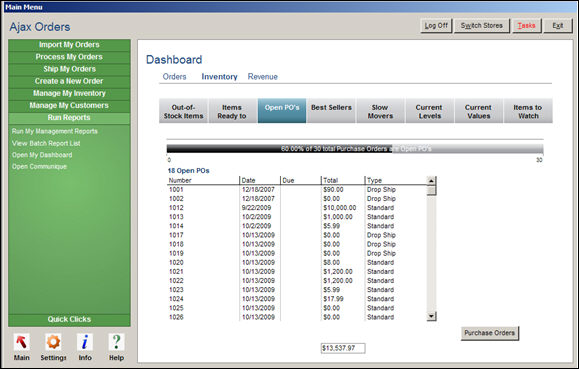
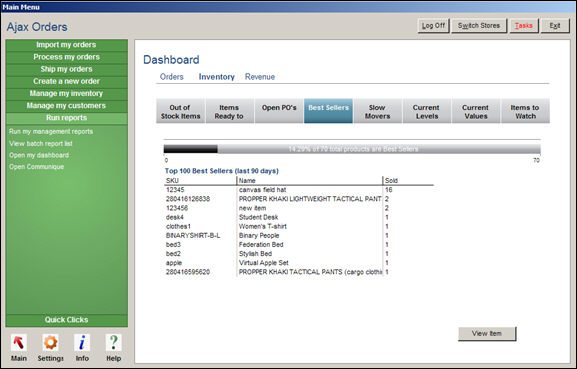
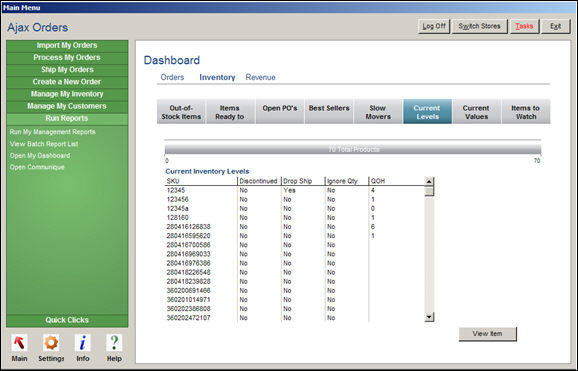
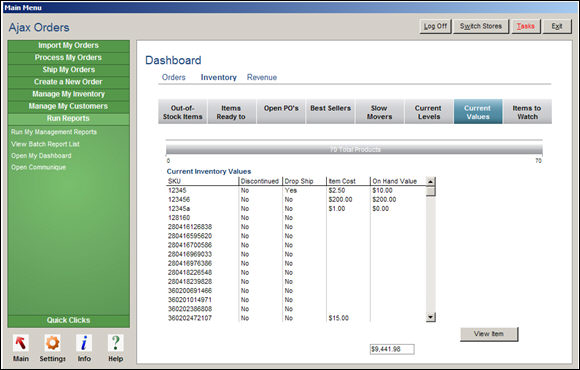
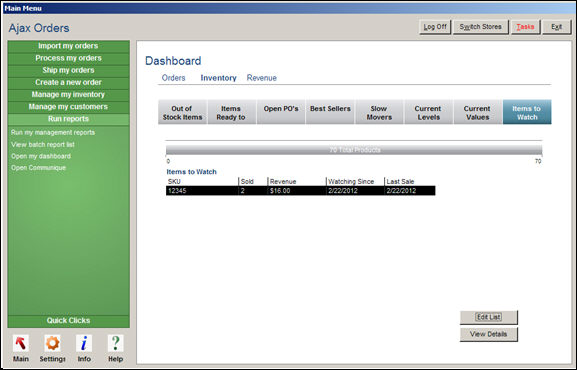
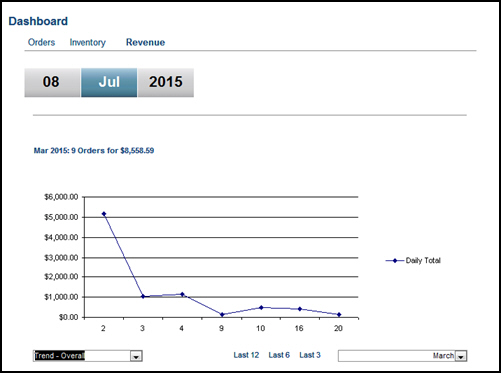
select any of these links on the program screen to change the type of data viewed
the summary at the bottom of the screen displays the current number of orders, inventory items or revenue in the system
select the icons in the middle of the screen to see more detailed information about each category
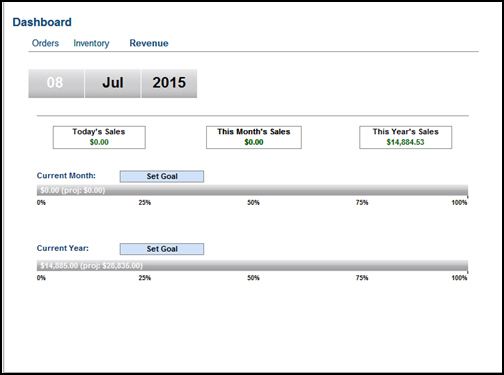
the day's, month's or year's sales, actual and projected, are displayed
select the Set Goal button to initially enter the projected sales values
select the Day, Month, or Year, to change the view
Created: 2/22/12
Revised: 7/8/15
Published: 08/19/15